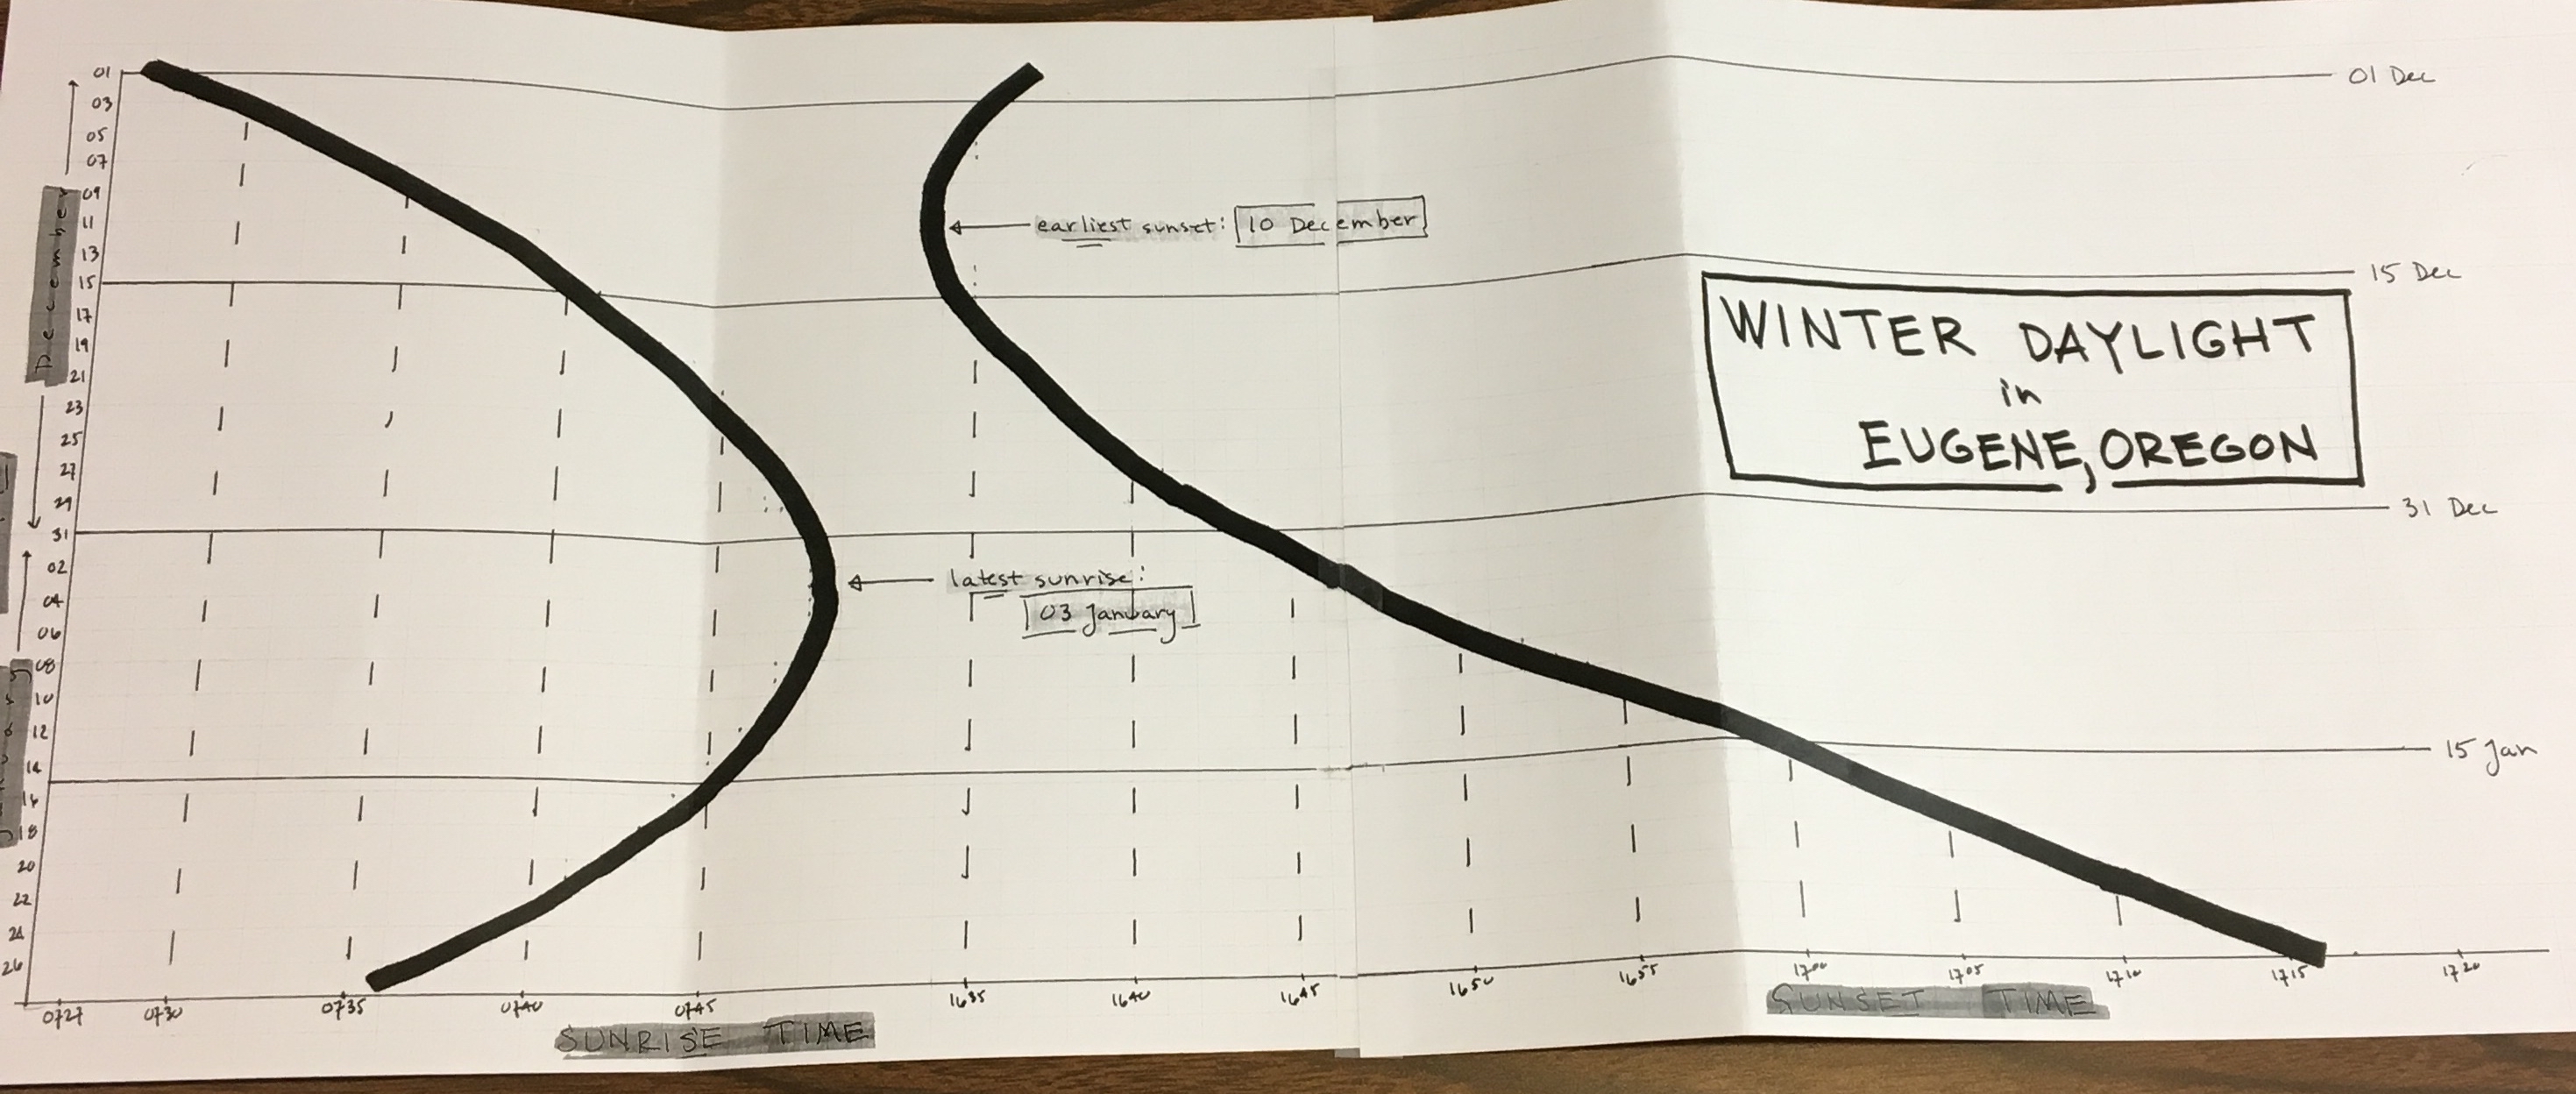
This was created by a friend of mine who is a Landscape Architecture professor here in the College of Design. Basically he took the published data for the dates and times of the sunrise and sunset and created a chart. It shows the dates and times of the earliest SUNSET, after which the light lasts a little bit longer each evening. Also on the chart is the time of the latest SUNRISE, afterwhich the sunrise will begin rising a little bit earlier as the planet makes its way around the sun. Great graphic of this phenomenon, in my opinion. 🙂